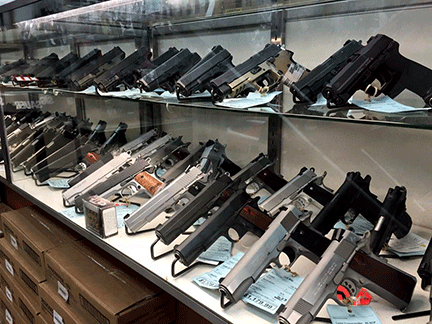
Attorney General Kamala D. Harris on Wednesday announced the release of firearms sales data in California on OpenJustice, the first-of-its-kind open data initiative she launched last September. The new firearms data section of OpenJustice shows how firearms sales have changed over the last two decades and includes a county-by-county breakdown. It also sheds light on what types of guns are purchased in California and how guns change hands.
“The dramatic spike in gun sales over the last ten years reflects the continued need for smart and sensible gun safety laws,” said Attorney General Harris. “Today’s release is a continuation of my commitment to transparency and the implementation of informed data-driven public policy. This unprecedented release of firearms sales data will allow us to better understand trends and to keep our communities safe.”
Data released Wednesday by the California Department of Justice shows Contra Costa County has seen a growth in gun sales between 2001 to 2015 of 129%.
According to data, 53% of firearms purchased in Contra Costa were long guns (99,640) versus 47% of sales which were short guns (87,062) between 2001 to 2015.
Key Findings of the report:
- Gun transactions have been growing in recent years, increasing 2.5 times between 2007 and 2013
- New guns have steadily become a larger percentage of transactions (~75%) compared to used guns
- Most guns are sold by dealers (65% of handguns, 83% of long guns), followed by private parties (17% of handguns, 9% of long guns)
- A small number of dealerships (5%) account for over half of total sales
- Gun purchases have been increasing in every county, with a few counties contributing a disproportionate amount of growth
Counties with the biggest growth in Gun Sales from 2001 to 2015 include:
- Sacramento: 406%
- San Bernardino: 385%
- Ventura: 256%
- Riverside: 220%
- Kern: 209%
- Orange: 202%
- Los Angeles: 190%
- San Diego: 174%
- Santa Clara: 156%
- Fresno: 144%
- Contra Costa: 129%
- Alameda: 68%
- San Francisco: 57%
The top three manufacturers in terms of guns sold in 2015 were Smith and Wesson (13%), Glock (11%), and Ruger (9%). The top ten manufacturers accounted for 60% of guns sold in 2015.
Of the sales, in 2007, new handguns accounted for just over 60% of all handgun sales. In 2014 and 2015, about 75% of handguns sold were new. In other words, not only are more guns being sold, more new guns are being sold.
The California Department of Justice says about 65% of CA handgun transactions are dealer sales. 15-20% are private party transfers, 5-10% are out of state registration, almost 10% are curios/relics. 80% of long gun sales are through dealers, with the remaining transactions primarily split between private party transfer and out of state registration.
Meanwhile, nationally, its estimated that 20-40% of sales occur at gun shows. In California, less than 2% of recorded gun transactions occur at gun shows.
The report also showed that from 1996 to 2007, the number of gun dealerships dropped by almost two-thirds while gun sales stayed relatively flat. The dramatic growth (240%) in gun transactions from 2008 to 2015 has not been accompanied by similar growth in the number of licensed gun dealerships, which only increased by 40%. The concentration of sales among gun dealers has increased in the past two decades.
Source:
https://openjustice.doj.ca.gov/firearms/overview#/total-gun-sales-by-county-chart


